Introduction
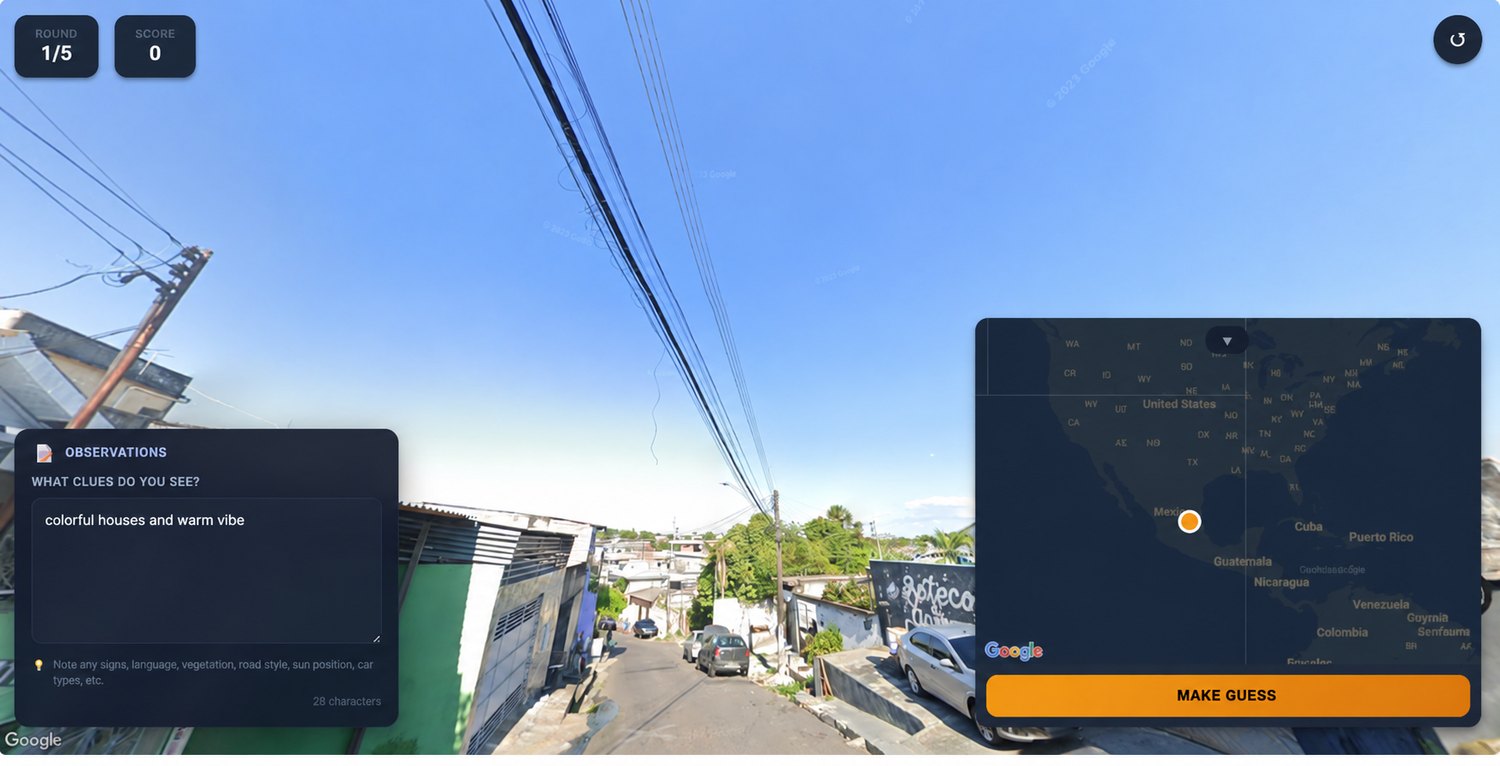
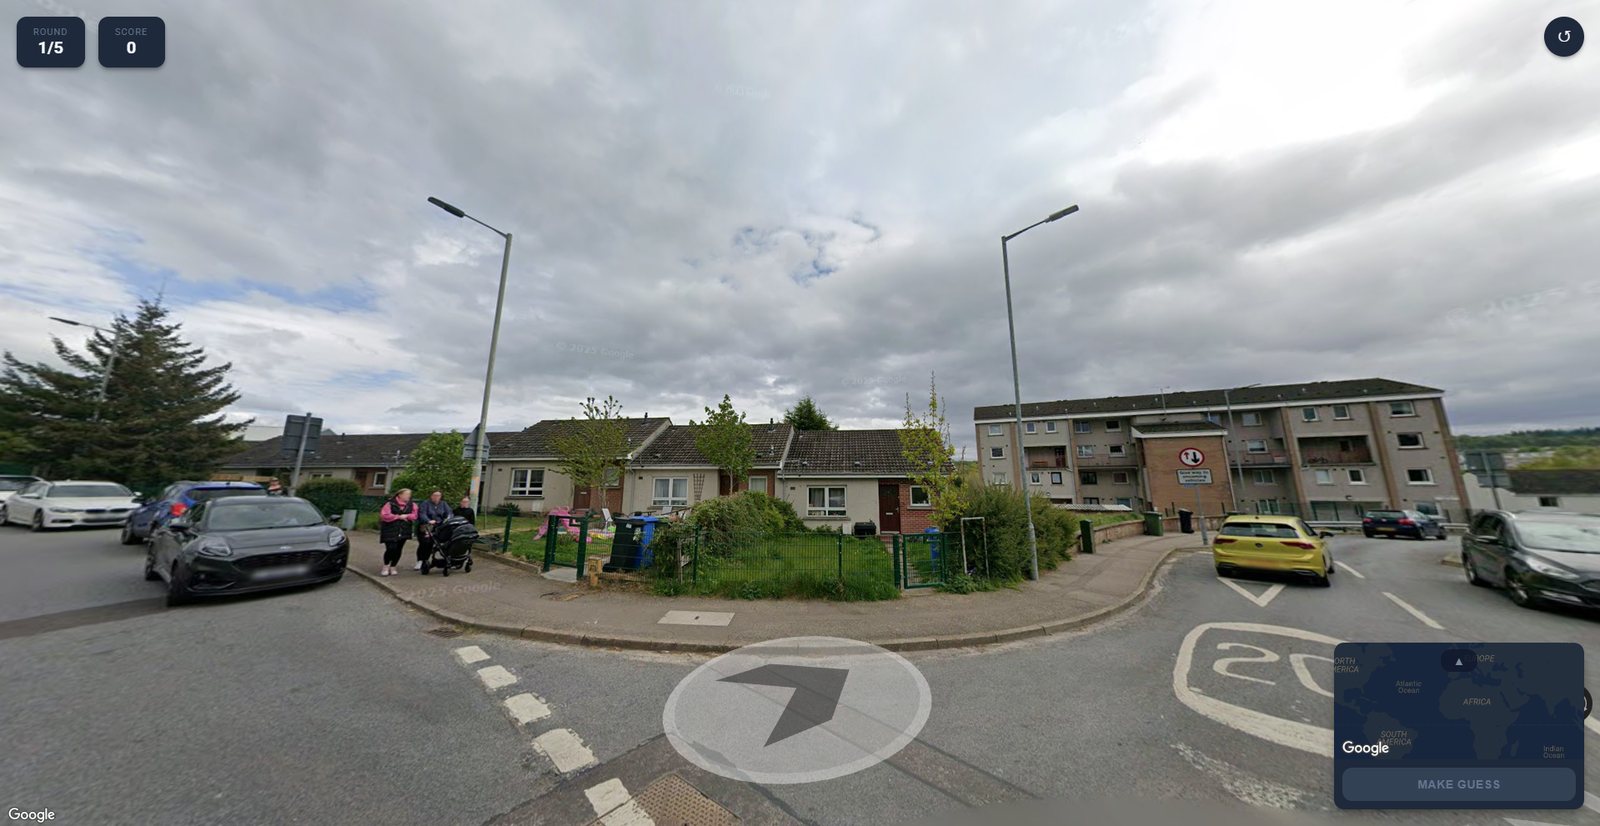
Modern Vision-Language Models (VLMs) perform well above the human baseline in geolocalization tasks. However, most efforts to study AI behavior on the task remain limited to static image-based retrieval, classification, and predictions. We argue that faithful recreation of the task should involve embodied navigation, where a multimodal agent autonomously explores its surroundings to gather observations before submitting a prediction.
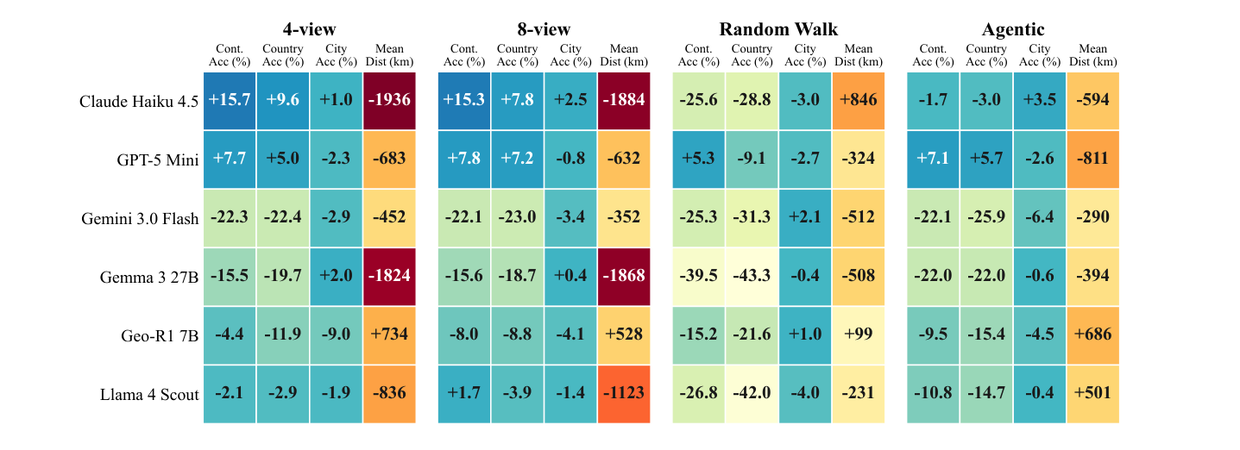
To this end, we introduce GeoAgent, an agentic environment-based benchmark that requires agents to navigate Street View environments to refine their geolocalization through reasoning sequentially. Our analysis shows that modern VLMs struggle to discern regional patterns while succeeding at country- and continent-level predictions. When compared to static image-based baselines, agentic navigation significantly improves accuracy across established metrics. We also note severe bias in a developed/developing region context across frontier model architectures and poor self-improvement capabilities given incorrect priors.
The Environment
| Action | Description |
|---|---|
| ROTATE:<degrees> | Rotate to a specific heading (0–360°) |
| ROTATE_LEFT | Rotate 90° left from current view |
| ROTATE_RIGHT | Rotate 90° right from current view |
| ROTATE_BEHIND | Rotate 180° to look behind |
| LOOK_UP | Tilt the camera up by 20° |
| LOOK_DOWN | Tilt the camera down by 20° |
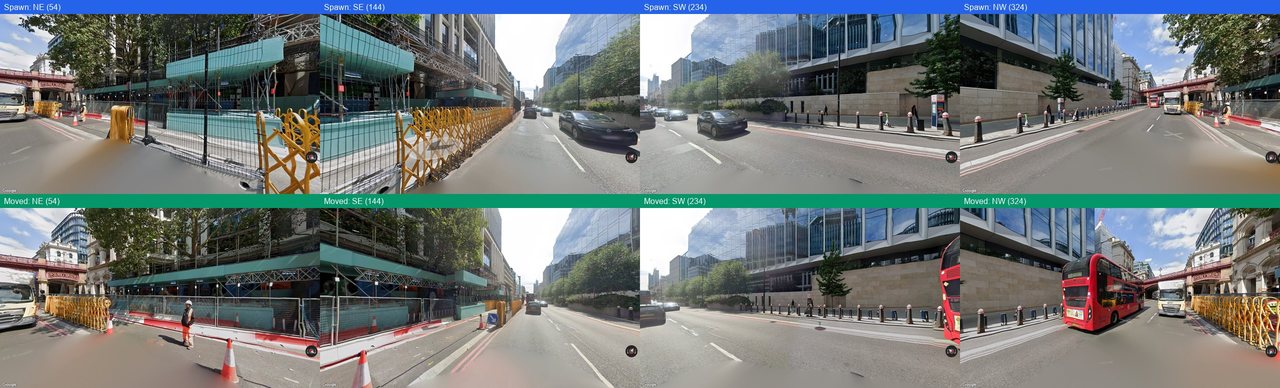
| MOVE_FORWARD | Move forward along the road or path |
| RETURN_START | Return to the starting position |
| GUESS | Submit the final location guess |
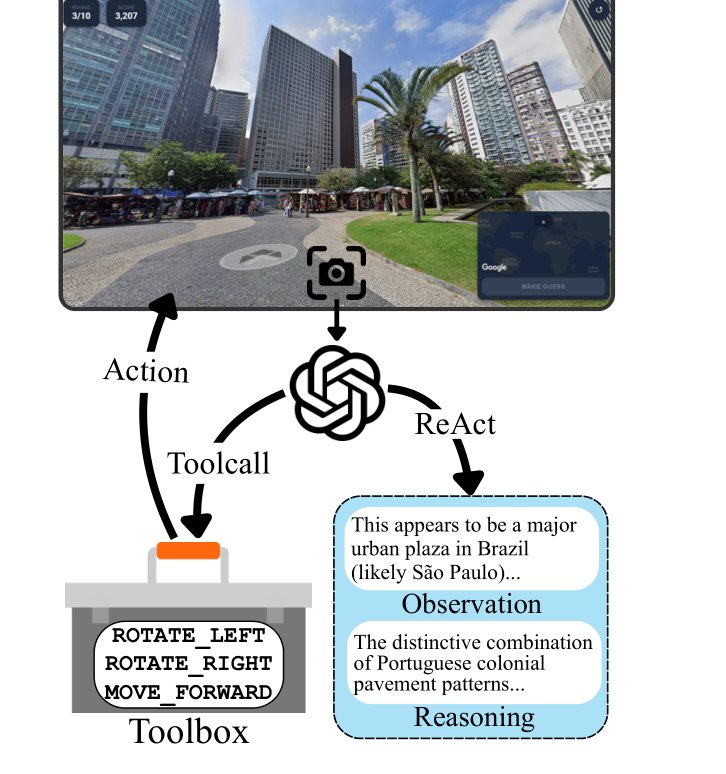
Table 1. The nine tool calls available to agents. Each turn the model returns observations, reasoning, confidence, an action, and a current guess as JSON, carrying up to five prior observations as context. Exploration is capped at eight actions.
Data
100 cities are stratified into five recognizability tiers by annual visitor numbers, a proxy for representation in web-scale training data. The distribution is deliberately inverted: Tier 5 supplies 40% of samples, Tier 1 only 2.85%. For each city, 100 coordinates were sampled within a two-mile radius; points without navigable Street View were dropped, leaving 1,200 samples. Cities are additionally tagged developed or developing per UNCTAD classifications.
| Tier | # Cities | Samples | Share (%) | Example cities | Developed | Developing |
|---|---|---|---|---|---|---|
| Tier 1 | 5 | 34 | 2.85 | New York, Tokyo | 5 | 0 |
| Tier 2 | 10 | 86 | 7.14 | Rome, Mumbai | 5 | 5 |
| Tier 3 | 25 | 257 | 21.42 | Bern, Bangalore | 10 | 15 |
| Tier 4 | 25 | 343 | 28.56 | Oulu, Mombasa | 12 | 13 |
| Tier 5 | 35 | 480 | 40.00 | Inuvik, Siem Reap | 14 | 21 |
| Total | 100 | 1,200 | 100.00 | — | 46 | 54 |
Table 2. Tier-wise composition of the dataset, with example cities and development status.

Results
| Model | Mean dist. | Median dist. | Reas. len. | Cont. acc | Country acc | City acc |
|---|
Table 3. Performance across conditions and models. Bold = best, underline = second-best per condition. Accuracies in %. Lower distance and reasoning length are better.
Navigation helps, conditionally
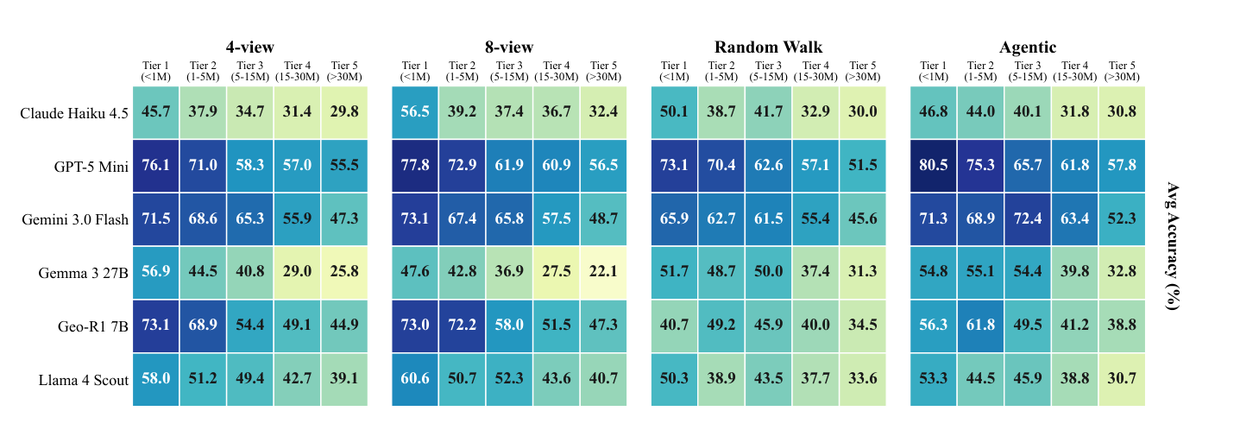
Gemini 3.0 Flash improves from 39.5% to 50.1% city accuracy over the static 4-view, with median error dropping to 5 km. Llama 4 Scout and Geo-R1 7B degrade relative to their static baselines.
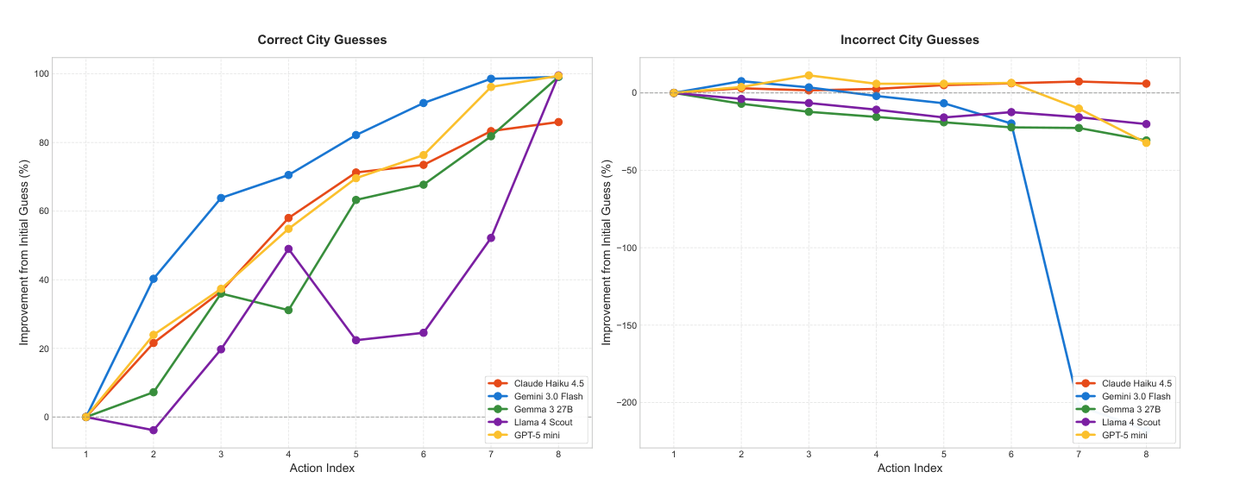
Refinement, not recovery
Successful rounds open at a median 847 km from target; failed rounds at 2,341 km. Initial distance predicts final accuracy (β = −0.43, p < 0.001). Models rarely recover from incorrect priors.
Developed-region bias
Mean Haversine error runs 50–103% higher in developing regions across all models. An image-quality audit rules out coverage and sharpness as explanations.
Exploration strategy varies
Llama 4 Scout uses 7.55 of 8 actions but 6.14 are rotations against 0.41 moves. Gemini 3.0 Flash favors forward movement. Action quality matters more than quantity (|ρ| < 0.25).
Unlimited actions do not help
Lifting the 8-action cap raised GPT-5 Mini's error from 900 to 1,218 km and Llama 4 Scout's by 76%, at up to 56× the per-round cost.
The last mile
Country accuracy runs 52–81% but city accuracy only 14–50%. Countries with the highest misclassification rates carry no country-specific vocabulary in model reasoning chains.